
Commercial Analytics: Shoozies
Business owners, designers, and architects are always looking for ways to maximize and improve the consumer experience. Virtual and Augmented Realities are providing us with new avenues to both understand how a user behaves in a physical store today, and to create the new digital shopping paradigms of tomorrow.
Our prototype explores the ideas of physical store simulation and testing. It also lays a foundation for how user interaction analytics can be helpful in any digital experience. In this case, the ability to determine optimal product placement and product interest can be invaluable when planning a store layout or investigating new potential products.
In this prototype, we created a shoe store where users can join in a multiplayer scenario to explore the store. Eye tracking data for each product is being recorded using Tobii G2OM.
With the aggregated recorded data, we can then analyze optimal product placement and product interest.
| Device | Version | Download |
|---|---|---|
| Pico Neo 2 Eye | v1.0.0 | |
| HTC VIVE Pro Eye | v1.0.0 |
Table of Contents
Running the Prototype
Running the prototype on the HTC VIVE Pro Eye will launch the menu (see image below), allowing you to host or join sessions across networks.
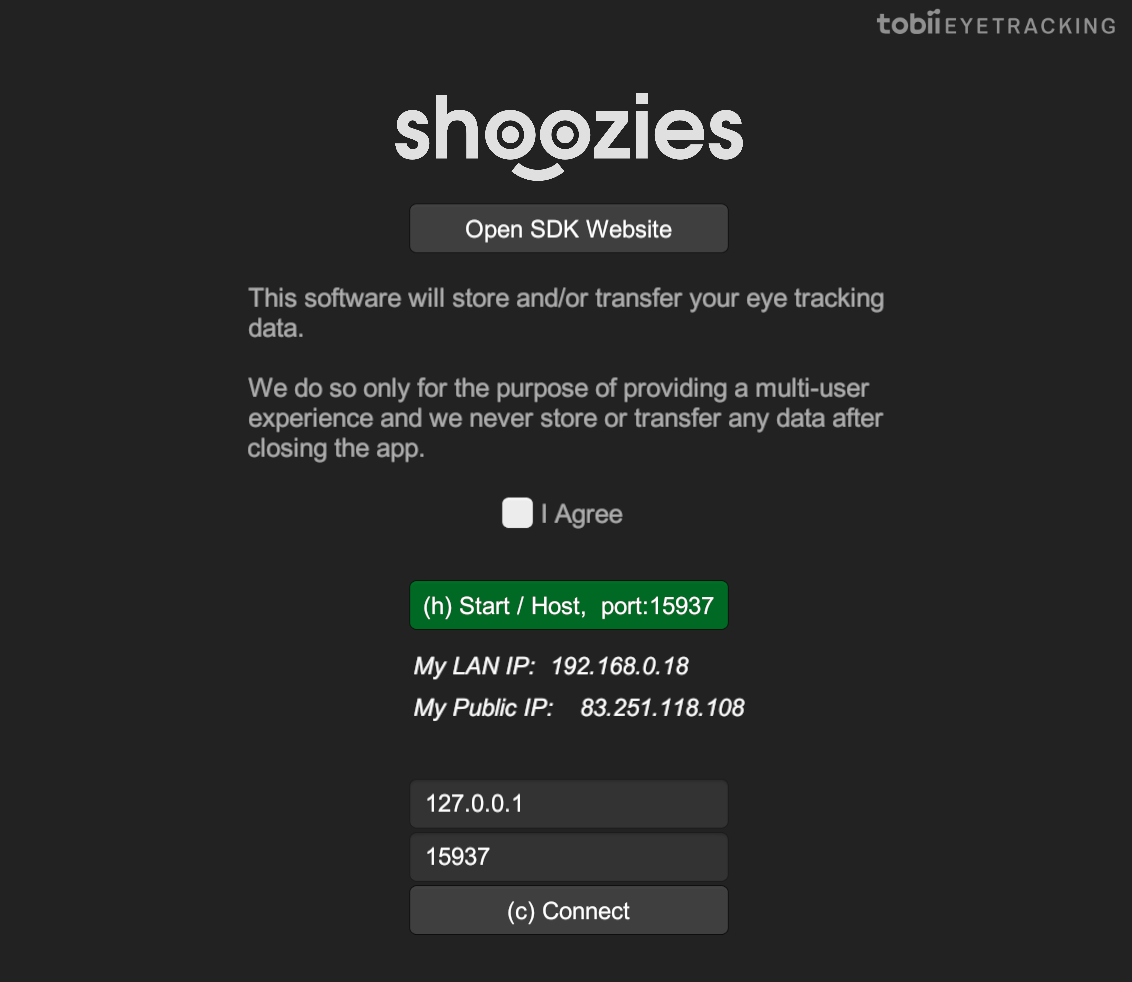
Pico Neo 2 Eye users can only connect to each other automatically on the LAN. The app will join an existing session if one exists, otherwise host a new.
All users need to accept that their eye tracking data is transferred via network according to Tobii’s Data Transparency Policy.
Remember to turn on both your controllers before starting the prototype to be able to track the avatar hands properly.
Step 1: Record Data
Users are instructed to browse the store as they normally would, to find a pair of shoes they like. Every shoe records the total gaze time and number of times being focused for each participant. We also collect data about which product locations are viewed the most.
After the users browse the store, it’s time to analyze the data.
Step 2: Analyze the Data
Outside the front of the store, there’s a place to analyze the data being recorded.
Product Settings
On the left, there are toggles to hide/show the shoes, the shoe statistics, and the most viewed locations.
Enable Products will simply hide/show the shoes.
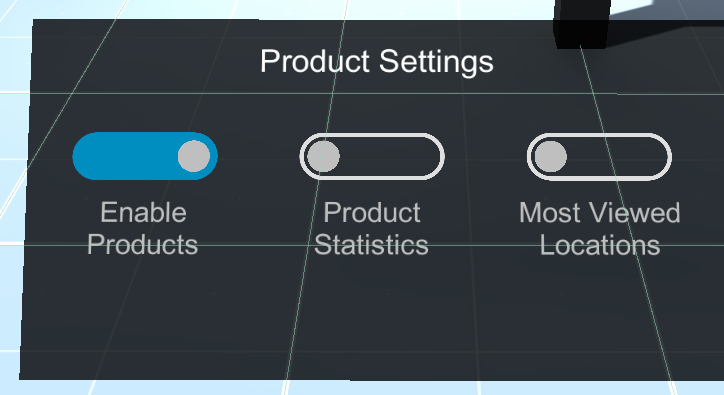
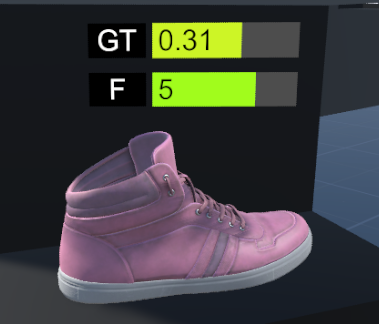
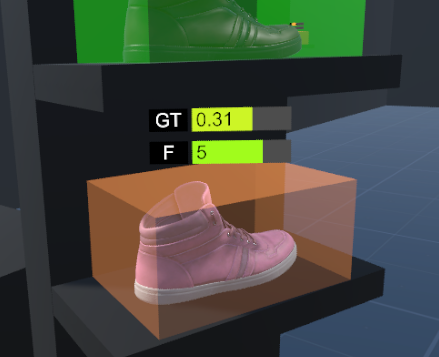
Product Statistics are color-coded from red to green for each metric, total gaze time (GT) and number of times being focused (F). Since we want to directly compare products, all bars are relative comparisons and will scale based on the maximum and minimum values of all the shoes.
Most Viewed Locations are color-coded from green (most viewed) to red (least viewed). These are also scaled for direct relative comparison.
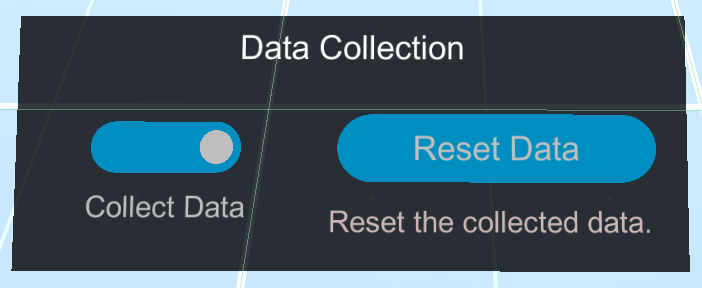
Data Collection
On the left, you can start and stop data recording using the toggle. Data collection will continue during your analysis unless you stop it.
You can also reset the data at any time.
Sorted Product Panel
On the right, there is a product panel that can be sorted in descending order by the metrics being recorded – in this case, Total Gaze Time and Number of Focuses.
Step 3: Take actions based on the data
You can also act on the insights gained from the analysis of the products. We added two data-driven shoe placement algorithms to optimize the layout.
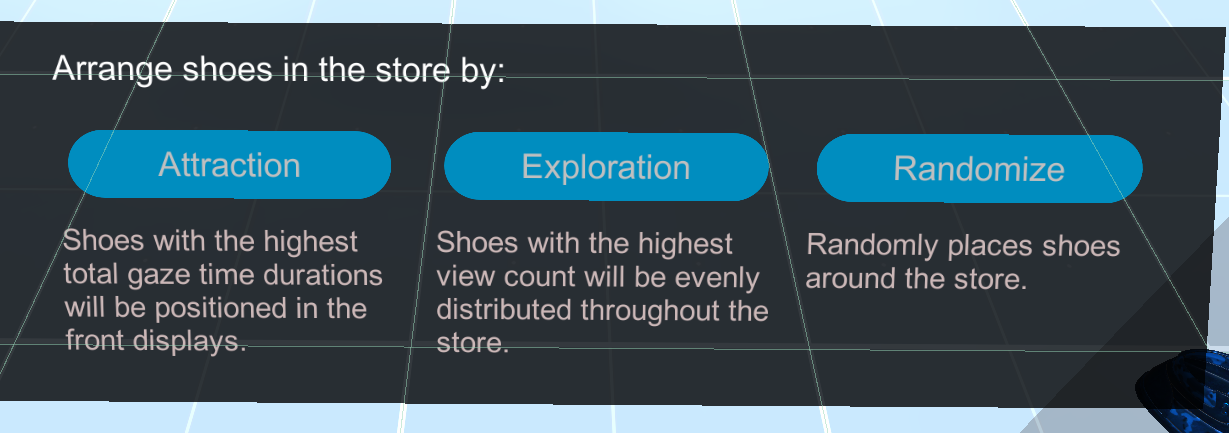
Attraction: Optimizes the store layout for attracting people, placing the shoes drawing most interest at the store front.
Exploration: Optimizes the store layout by placing the shoes viewed most times evenly distributed throughout the store.
You can also randomize the placement of the shoes. This is useful to do after each browsing session, especially when finding the ideal product placement over multiple sessions.
Collaboration
This prototype allows you to analyze the data together with others which can be a powerful way to more easily understand the data and quickly test different metrics and scenarios live.
Expanding on This Prototype
In this prototype, we have chosen a shoe store, but this system can be used in many other scenarios where knowing which objects a user is paying attention to can provide value to the company.
We have also only chosen to record gaze time and number of focuses, but more insights would be gained from other metrics.
See our Analytics section to read more about eye tracking analytics.